
Page 57 - 105考選統計
P. 57
43
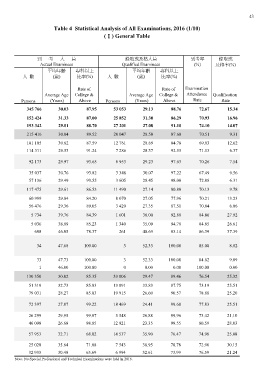
Table 4 Statistical Analysis of All Examinations, 2016 (1/10)
(Ⅰ) General Table
到考人員 錄取或及格人員 到考率 錄取或
(%) 及格率(%)
Actual Examinees Qualified Examinees
平均年齡 專科以上 平均年齡 專科以上
人數 (歲) 比率(%) 人數 (歲) 比率(%)
Persons Average Age Rate of Persons Average Age Rate of Examination
(Years) College & (Years) College &
Attendance Qualification
Above Above Rate Rate
345 766 30.03 87.95 53 053 29.13 88.76 72.67 15.34
152 424 31.33 87.00 25 852 31.30 86.29 70.93 16.96
193 342 29.01 88.70 27 201 27.08 91.10 74.10 14.07
215 416 30.04 89.52 20 047 28.58 87.60 70.51 9.31
101 105 30.62 87.59 12 761 28.69 84.78 69.83 12.62
114 311 29.53 91.24 7 286 28.37 92.55 71.13 6.37
92 173 29.97 93.65 6 953 29.23 97.63 70.26 7.54
35 037 30.76 93.82 3 348 30.07 97.22 67.49 9.56
57 136 29.49 93.55 3 605 28.45 98.00 72.08 6.31
117 475 29.61 86.53 11 490 27.14 80.80 70.13 9.78
60 999 29.84 84.20 8 070 27.05 77.96 70.21 13.23
56 476 29.36 89.05 3 420 27.35 87.51 70.04 6.06
5 734 39.76 84.39 1 601 36.00 92.88 84.86 27.92
5 036 38.89 85.23 1 340 35.09 94.78 84.65 26.61
46.05 78.37 40.69 83.14 86.39 37.39
698 261
34 47.68 100.00 3 52.33 100.00 85.00 8.82
33 47.73 100.00 3 52.33 100.00 84.62 9.09
1 46.00 100.00 0 0.00 0.00 100.00 0.00
29.47 76.54 25.32
130 350 30.02 85.35 33 006 33.83 89.46 73.19 25.51
26.60 87.75 78.88 25.20
51 319 32.73 85.83 13 091 90.57
79 031 28.27 85.03 19 915 24.41 77.83 25.51
99.68
72 397 27.87 99.22 18 469 26.88 73.42 21.10
23.35 99.96 80.59 28.03
26 299 29.95 99.87 5 548 99.55
46 098 26.68 98.85 12 921 35.90 74.98 25.08
76.47
57 953 32.71 68.02 14 537 38.95 72.96 30.15
32.61 78.78 76.59 21.24
25 020 35.64 71.08 7 543 73.99
32 933 30.49 65.69 6 994
Note: No Special Professional and Technical Examinations were held in 2016.