
Page 59 - 105考選統計
P. 59
45
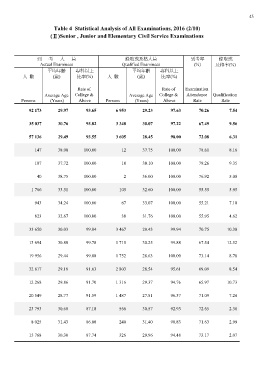
Table 4 Statistical Analysis of All Examinations, 2016 (2/10)
(Ⅱ)Senior , Junior and Elementary Civil Service Examinations
到考人員 錄取或及格人員 到考率 錄取或
(%) 及格率(%)
Actual Examinees Qualified Examinees
平均年齡 專科以上 平均年齡 專科以上
人數 (歲) 比率(%) 人數 (歲) 比率(%)
Persons Average Age Rate of Persons Average Age Rate of Examination
(Years) College & (Years) College & Attendance Qualification
Above Above Rate Rate
92 173 29.97 93.65 6 953 29.23 97.63 70.26 7.54
35 037 30.76 93.82 3 348 30.07 97.22 67.49 9.56
57 136 29.49 93.55 3 605 28.45 98.00 72.08 6.31
147 38.00 100.00 12 37.75 100.00 78.61 8.16
107 37.72 100.00 10 38.10 100.00 79.26 9.35
40 38.75 100.00 2 36.00 100.00 76.92 5.00
1 766 33.51 100.00 105 32.60 100.00 55.55 5.95
943 34.24 100.00 67 33.07 100.00 55.21 7.10
823 32.67 100.00 38 31.76 100.00 55.95 4.62
33 650 30.03 99.84 3 467 29.43 99.94 70.75 10.30
13 694 30.88 99.78 1 715 30.25 99.88 67.54 12.52
19 956 29.44 99.88 1 752 28.63 100.00 73.14 8.78
32 817 29.18 91.63 2 803 28.54 95.61 69.09 8.54
12 268 29.86 91.70 1 316 29.37 94.76 65.97 10.73
20 549 28.77 91.59 1 487 27.81 96.37 71.09 7.24
23 793 30.68 87.18 566 30.57 92.93 72.65 2.38
8 025 31.43 86.08 240 31.40 90.83 71.63 2.99
15 768 30.30 87.74 326 29.96 94.48 73.17 2.07