
Page 75 - 105考選統計
P. 75
61
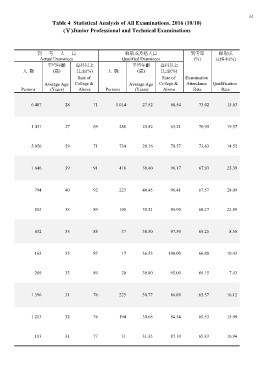
Table 4 Statistical Analysis of All Examinations, 2016 (10/10)
(Ⅴ)Junior Professional and Technical Examinations
到考人員 錄取或及格人員 到考率 錄取或
(%) 及格率(%)
Actual Examinees Qualified Examinees
平均年齡 專科以上 平均年齡 專科以上
人數 (歲) 比率(%) 人數 (歲) 比率(%)
Persons Average Age Rate of Persons Average Age Rate of Examination
(Years) College & (Years) College & Attendance Qualification
Above Above Rate Rate
6 487 28 71 1 014 27.52 68.54 73.02 15.63
1 431 27 69 280 25.82 63.21 70.95 19.57
5 056 29 71 734 28.16 70.57 73.63 14.52
1 646 39 91 418 39.40 96.17 67.93 25.39
794 40 92 223 40.45 96.41 67.57 28.09
852 38 89 195 38.21 95.90 68.27 22.89
432 35 88 37 38.30 97.30 68.25 8.56
163 35 87 17 36.53 100.00 66.80 10.43
269 35 89 20 39.80 95.00 69.15 7.43
1 396 31 76 225 30.77 84.89 65.57 16.12
1 213 32 76 194 30.68 84.54 65.53 15.99
183 31 77 31 31.35 87.10 65.83 16.94