
Page 71 - 105考選統計
P. 71
57
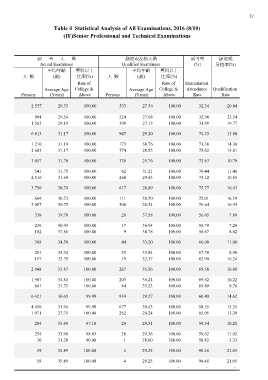
Table 4 Statistical Analysis of All Examinations, 2016 (8/10)
(Ⅳ)Senior Professional and Technical Examinations
到考人員 錄取或及格人員 到考率 錄取或
(%) 及格率(%)
Actual Examinees Qualified Examinees
平均年齡 專科以上 平均年齡 專科以上
人數 (歲) 比率(%) 人數 (歲) 比率(%)
Persons Average Age Rate of Persons Average Age Rate of Examination
(Years) College & (Years) College & Attendance Qualification
Above Above Rate Rate
2 557 29.33 100.00 533 27.36 100.00 32.34 20.84
994 29.54 100.00 224 27.68 100.00 32.90 22.54
1 563 29.19 100.00 309 27.13 100.00 31.99 19.77
6 813 31.17 100.00 947 29.20 100.00 74.33 13.90
1 210 31.19 100.00 173 30.76 100.00 71.30 14.30
5 603 31.17 100.00 774 28.85 100.00 75.02 13.81
3 057 31.70 100.00 330 29.76 100.00 72.63 10.79
541 31.75 100.00 62 31.21 100.00 70.44 11.46
2 516 31.69 100.00 268 29.43 100.00 73.12 10.65
3 756 30.74 100.00 617 28.89 100.00 75.77 16.43
669 30.73 100.00 111 30.50 100.00 72.01 16.59
3 087 30.75 100.00 506 28.54 100.00 76.64 16.39
338 39.70 100.00 26 37.58 100.00 56.05 7.69
236 40.49 100.00 17 36.94 100.00 55.79 7.20
102 37.88 100.00 9 38.78 100.00 56.67 8.82
398 34.58 100.00 44 33.20 100.00 66.00 11.06
281 35.34 100.00 25 33.84 100.00 67.39 8.90
19 32.37 100.00 62.90 16.24
117 32.75 100.00
2 848 33.87 100.00 287 35.36 100.00 69.58 10.08
1 987 34.81 100.00 203 36.24 100.00 69.62 10.22
861 31.71 100.00 84 33.23 100.00 69.49 9.76
6 421 30.65 99.98 939 29.27 100.00 60.40 14.62
4 450 31.94 99.98 677 30.43 100.00 58.55 15.21
1 971 27.75 100.00 262 26.24 100.00 65.05 13.29
284 33.69 97.18 29 29.31 100.00 59.54 10.21
254 33.98 98.03 28 29.36 100.00 59.62 11.02
30 31.20 90.00 1 28.00 100.00 58.82 3.33
19 35.89 100.00 4 29.25 100.00 90.48 21.05
19 35.89 100.00 4 29.25 100.00 90.48 21.05
- -
-- - -- -