
Page 81 - 106考選統計-光碟
P. 81
65
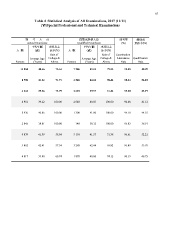
Table 4 Statistical Analysis of All Examinations, 2017 (11/11)
(Ⅵ)Special Professional and Technical Examinations
到考人員 錄取或及格人員 到考率 錄取或
(%) 及格率(%)
Actual Examinees Qualified Examinees
平均年齡 專科以上 平均年齡 專科以上
人數 (歲) 比率(%) 人數 (歲) 比率(%)
Persons Average Age Rate of Persons Average Age Rate of Examination
(Years) College & (Years) College & Attendance Qualification
Above Above Rate Rate
14 860 40.66 72.64 7 206 41.14 79.52 95.88 48.49
8 798 41.62 71.71 4 588 42.03 78.42 95.94 52.15
6 062 39.26 73.99 2 618 39.57 81.44 95.80 43.19
4 981 39.22 100.00 2 048 40.03 100.00 94.48 41.12
2 936 40.06 100.00 1 308 41.00 100.00 94.10 44.55
2 045 38.01 100.00 740 38.32 100.00 95.03 36.19
9 879 41.39 58.84 5 158 41.57 71.38 96.61 52.21
5 862 42.41 57.54 3 280 42.44 69.82 96.89 55.95
4 017 39.90 60.74 1 878 40.06 74.12 96.19 46.75