
Page 63 - 105考選統計
P. 63
49
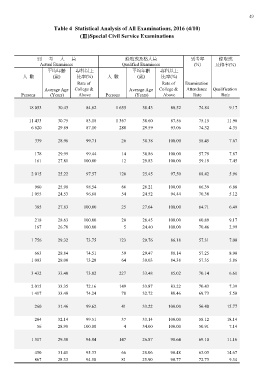
Table 4 Statistical Analysis of All Examinations, 2016 (4/10)
(Ⅲ)Special Civil Service Examinations
到考人員 錄取或及格人員 到考率 錄取或
(%) 及格率(%)
Actual Examinees Qualified Examinees
平均年齡 專科以上 平均年齡 專科以上
人數 (歲) 比率(%) 人數 (歲) 比率(%)
Persons Average Age Rate of Persons Average Age Rate of Examination
(Years) College & (Years) College & Attendance Qualification
Above Above Rate Rate
18 053 30.43 84.62 1 655 30.43 88.52 74.84 9.17
11 433 30.75 83.18 1 367 30.60 87.56 75.15 11.96
6 620 29.89 87.10 288 29.59 93.06 74.32 4.35
339 28.96 99.71 26 30.38 100.00 58.45 7.67
178 29.99 99.44 14 30.86 100.00 57.79 7.87
12 29.83 100.00 59.19 7.45
161 27.81 100.00
2 015 25.22 97.57 120 25.45 97.50 68.42 5.96
960 25.98 98.54 66 26.21 100.00 66.39 6.88
1 055 24.53 96.68 70.38 5.12
54 24.52 94.44
385 27.83 100.00 25 27.64 100.00 64.71 6.49
218 28.63 100.00 20 28.45 100.00 60.89 9.17
167 26.78 100.00 5 24.40 100.00 70.46 2.99
1 756 29.32 73.75 123 29.76 86.18 57.31 7.00
663 29.84 74.51 59 29.47 88.14 57.25 8.90
1 093 29.00 73.28 64 30.03 84.38 57.35 5.86
3 432 33.40 73.02 227 33.48 85.02 70.14 6.61
2 015 33.35 72.16 149 33.87 83.22 70.43 7.39
1 417 33.48 74.24 78 32.72 88.46 69.73 5.50
260 31.46 99.62 41 33.22 100.00 56.40 15.77
204 32.14 99.51 37 33.14 100.00 58.12 18.14
4 34.00 100.00 50.91 7.14
56 28.98 100.00
1 317 29.38 94.84 147 26.87 98.64 69.10 11.16
450 31.41 95.33 66 28.06 98.48 63.03 14.67
867 28.33 94.58 81 25.90 98.77 72.73 9.34