
Page 65 - 105考選統計
P. 65
51
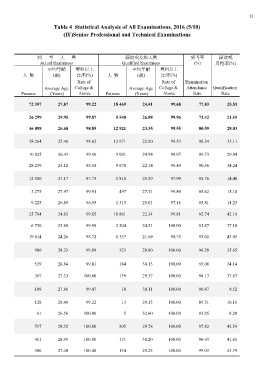
Table 4 Statistical Analysis of All Examinations, 2016 (5/10)
(Ⅳ)Senior Professional and Technical Examinations
到考人員 錄取或及格人員 到考率 錄取或
(%) 及格率(%)
Actual Examinees Qualified Examinees
平均年齡 專科以上 平均年齡 專科以上
人數 (歲) 比率(%) 人數 (歲) 比率(%)
Persons Average Age Rate of Persons Average Age Rate of Examination
(Years) College & (Years) College & Attendance Qualification
Above Above Rate Rate
72 397 27.87 99.22 18 469 24.41 99.68 77.83 25.51
26 299 29.95 99.87 5 548 26.88 99.96 73.42 21.10
46 098 26.68 98.85 12 921 23.35 99.55 80.59 28.03
38 264 25.46 98.62 12 671 22.80 99.53 90.34 33.11
10 025 26.43 99.96 3 001 24.94 99.97 89.73 29.94
28 239 25.12 98.14 9 670 22.14 99.40 90.56 34.24
12 500 27.17 97.73 1 810 25.59 97.90 85.76 14.48
3 275 27.97 99.91 497 27.11 99.80 85.62 15.18
9 225 26.89 96.95 1 313 25.01 97.18 85.81 14.23
25 764 24.63 99.05 10 861 22.34 99.81 92.74 42.16
6 750 25.68 99.99 2 504 24.51 100.00 91.87 37.10
19 014 24.26 98.72 8 357 21.69 99.75 93.05 43.95
906 28.23 99.89 323 29.80 100.00 96.28 35.65
539 28.84 99.81 184 30.13 100.00 95.06 34.14
139 29.37 100.00 98.13 37.87
367 27.33 100.00
189 27.86 99.47 18 30.11 100.00 90.87 9.52
128 28.48 99.22 13 29.15 100.00 89.51 10.16
5 32.60 100.00 93.85 8.20
61 26.56 100.00
717 28.32 100.00 305 29.78 100.00 97.82 42.54
411 28.95 100.00 171 30.20 100.00 96.93 41.61
134 29.25 100.00 99.03 43.79
306 27.48 100.00