
Page 67 - 105考選統計
P. 67
53
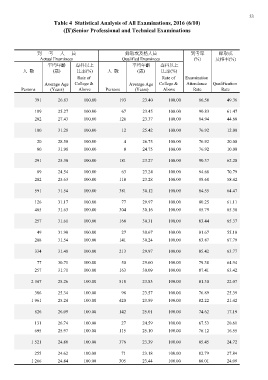
Table 4 Statistical Analysis of All Examinations, 2016 (6/10)
(Ⅳ)Senior Professional and Technical Examinations
到考人員 錄取或及格人員 到考率 錄取或
(%) 及格率(%)
Actual Examinees Qualified Examinees
平均年齡 專科以上 平均年齡 專科以上
人數 (歲) 比率(%) 人數 (歲) 比率(%)
Persons Average Age Rate of Persons Average Age Rate of Examination
(Years) College & (Years) College & Attendance Qualification
Above Above Rate Rate
391 26.83 100.00 193 23.40 100.00 86.50 49.36
109 25.27 100.00 67 23.45 100.00 90.83 61.47
282 27.43 100.00 126 23.37 100.00 84.94 44.68
100 31.28 100.00 12 25.42 100.00 76.92 12.00
20 28.50 100.00 4 26.75 100.00 76.92 20.00
80 31.98 100.00 8 24.75 100.00 76.92 10.00
291 25.30 100.00 181 23.27 100.00 90.37 62.20
89 24.54 100.00 63 23.24 100.00 94.68 70.79
202 25.63 100.00 118 23.28 100.00 88.60 58.42
591 31.54 100.00 381 30.12 100.00 84.55 64.47
126 31.17 100.00 77 29.97 100.00 80.25 61.11
465 31.63 100.00 304 30.16 100.00 85.79 65.38
257 31.61 100.00 168 30.31 100.00 83.44 65.37
49 31.90 100.00 27 30.67 100.00 81.67 55.10
208 31.54 100.00 141 30.24 100.00 83.87 67.79
334 31.48 100.00 213 29.97 100.00 85.42 63.77
77 30.71 100.00 50 29.60 100.00 79.38 64.94
163 30.09 100.00 87.41 63.42
257 31.71 100.00
2 347 25.26 100.00 518 23.83 100.00 81.30 22.07
386 25.34 100.00 98 23.57 100.00 76.89 25.39
1 961 25.24 100.00 420 23.89 100.00 82.22 21.42
826 26.09 100.00 142 25.01 100.00 74.62 17.19
131 26.74 100.00 27 24.59 100.00 67.53 20.61
115 25.10 100.00 76.12 16.55
695 25.97 100.00
1 521 24.80 100.00 376 23.39 100.00 85.45 24.72
255 24.62 100.00 71 23.18 100.00 82.79 27.84
1 266 24.84 100.00 305 23.44 100.00 86.01 24.09