
Page 69 - 105考選統計
P. 69
55
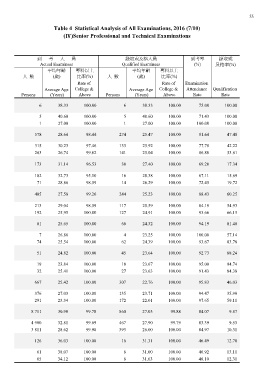
Table 4 Statistical Analysis of All Examinations, 2016 (7/10)
(Ⅳ)Senior Professional and Technical Examinations
到考人員 錄取或及格人員 到考率 錄取或
(%) 及格率(%)
Actual Examinees Qualified Examinees
平均年齡 專科以上 平均年齡 專科以上
人數 (歲) 比率(%) 人數 (歲) 比率(%)
Persons Average Age Rate of Persons Average Age Rate of Examination
(Years) College & (Years) College & Attendance Qualification
Above Above Rate Rate
6 38.33 100.00 6 38.33 100.00 75.00 100.00
5 40.60 100.00 5 40.60 100.00 71.43 100.00
1 27.00 100.00
1 27.00 100.00 100.00 100.00
578 28.64 98.44 274 25.47 100.00 81.64 47.40
315 30.23 97.46 133 25.92 100.00 77.78 42.22
263 26.74 99.62 141 25.04 100.00 86.80 53.61
173 31.14 96.53 30 27.40 100.00 69.20 17.34
102 32.73 95.10 16 28.38 100.00 67.11 15.69
71 28.86 98.59 14 26.29 100.00 72.45 19.72
405 27.58 99.26 244 25.23 100.00 88.43 60.25
213 29.04 98.59 117 25.59 100.00 84.19 54.93
127 24.91 100.00 93.66 66.15
192 25.95 100.00
81 25.65 100.00 66 24.32 100.00 94.19 81.48
7 26.86 100.00 4 23.25 100.00 100.00 57.14
74 25.54 100.00 83.78
62 24.39 100.00 93.67
51 24.82 100.00 45 23.64 100.00 92.73 88.24
19 23.84 100.00 18 23.67 100.00 95.00 94.74
27 23.63 100.00 91.43 84.38
32 25.41 100.00
667 25.42 100.00 307 22.76 100.00 95.83 46.03
376 27.03 100.00 135 23.71 100.00 94.47 35.90
172 22.01 100.00 97.65 59.11
291 23.34 100.00
8 711 30.98 99.78 860 27.03 99.88 84.07 9.87
4 900 32.81 99.69 467 27.90 99.79 83.39 9.53
3 811 28.62 99.90 84.97 10.31
393 26.00 100.00
126 36.03 100.00 16 31.31 100.00 46.49 12.70
61 38.07 100.00 8 31.00 100.00 46.92 13.11
8 31.63 100.00 46.10 12.31
65 34.12 100.00